📊 Jupyter에서 AI 데이터 분석하기
CLI vs Jupyter 비교 - 모니터링 알람 데이터 분석을 통한 체계적 학습
📚 학습 단계
🔹 사전 준비
목표: Jupyter 환경과 데이터를 준비합니다
환경 설정
# Jupyter 설치 확인
jupyter --version

# 필요한 라이브러리 설치
pip install pandas matplotlib numpy
데이터 준비
📋 필요한 파일:
- Alarm_list_*.csv: 알람 데이터 (1,129건)
- Failure_list_*.csv: 장애 데이터 (75건)
폴더 구조
your_project/
├── data/
│   ├── Alarm_list_*.csv
│   └── Failure_list_*.csv
└── notebooks/
    └── monitoring_analysis.ipynb
Jupyter 시작
# 프로젝트 폴더에서 실행
cd your_project
jupyter lab

# 새 노트북 생성: Python 3 선택
💡 실행 화면 예시: 아래와 같은 Jupyter Lab 환경에서 작업하게 됩니다
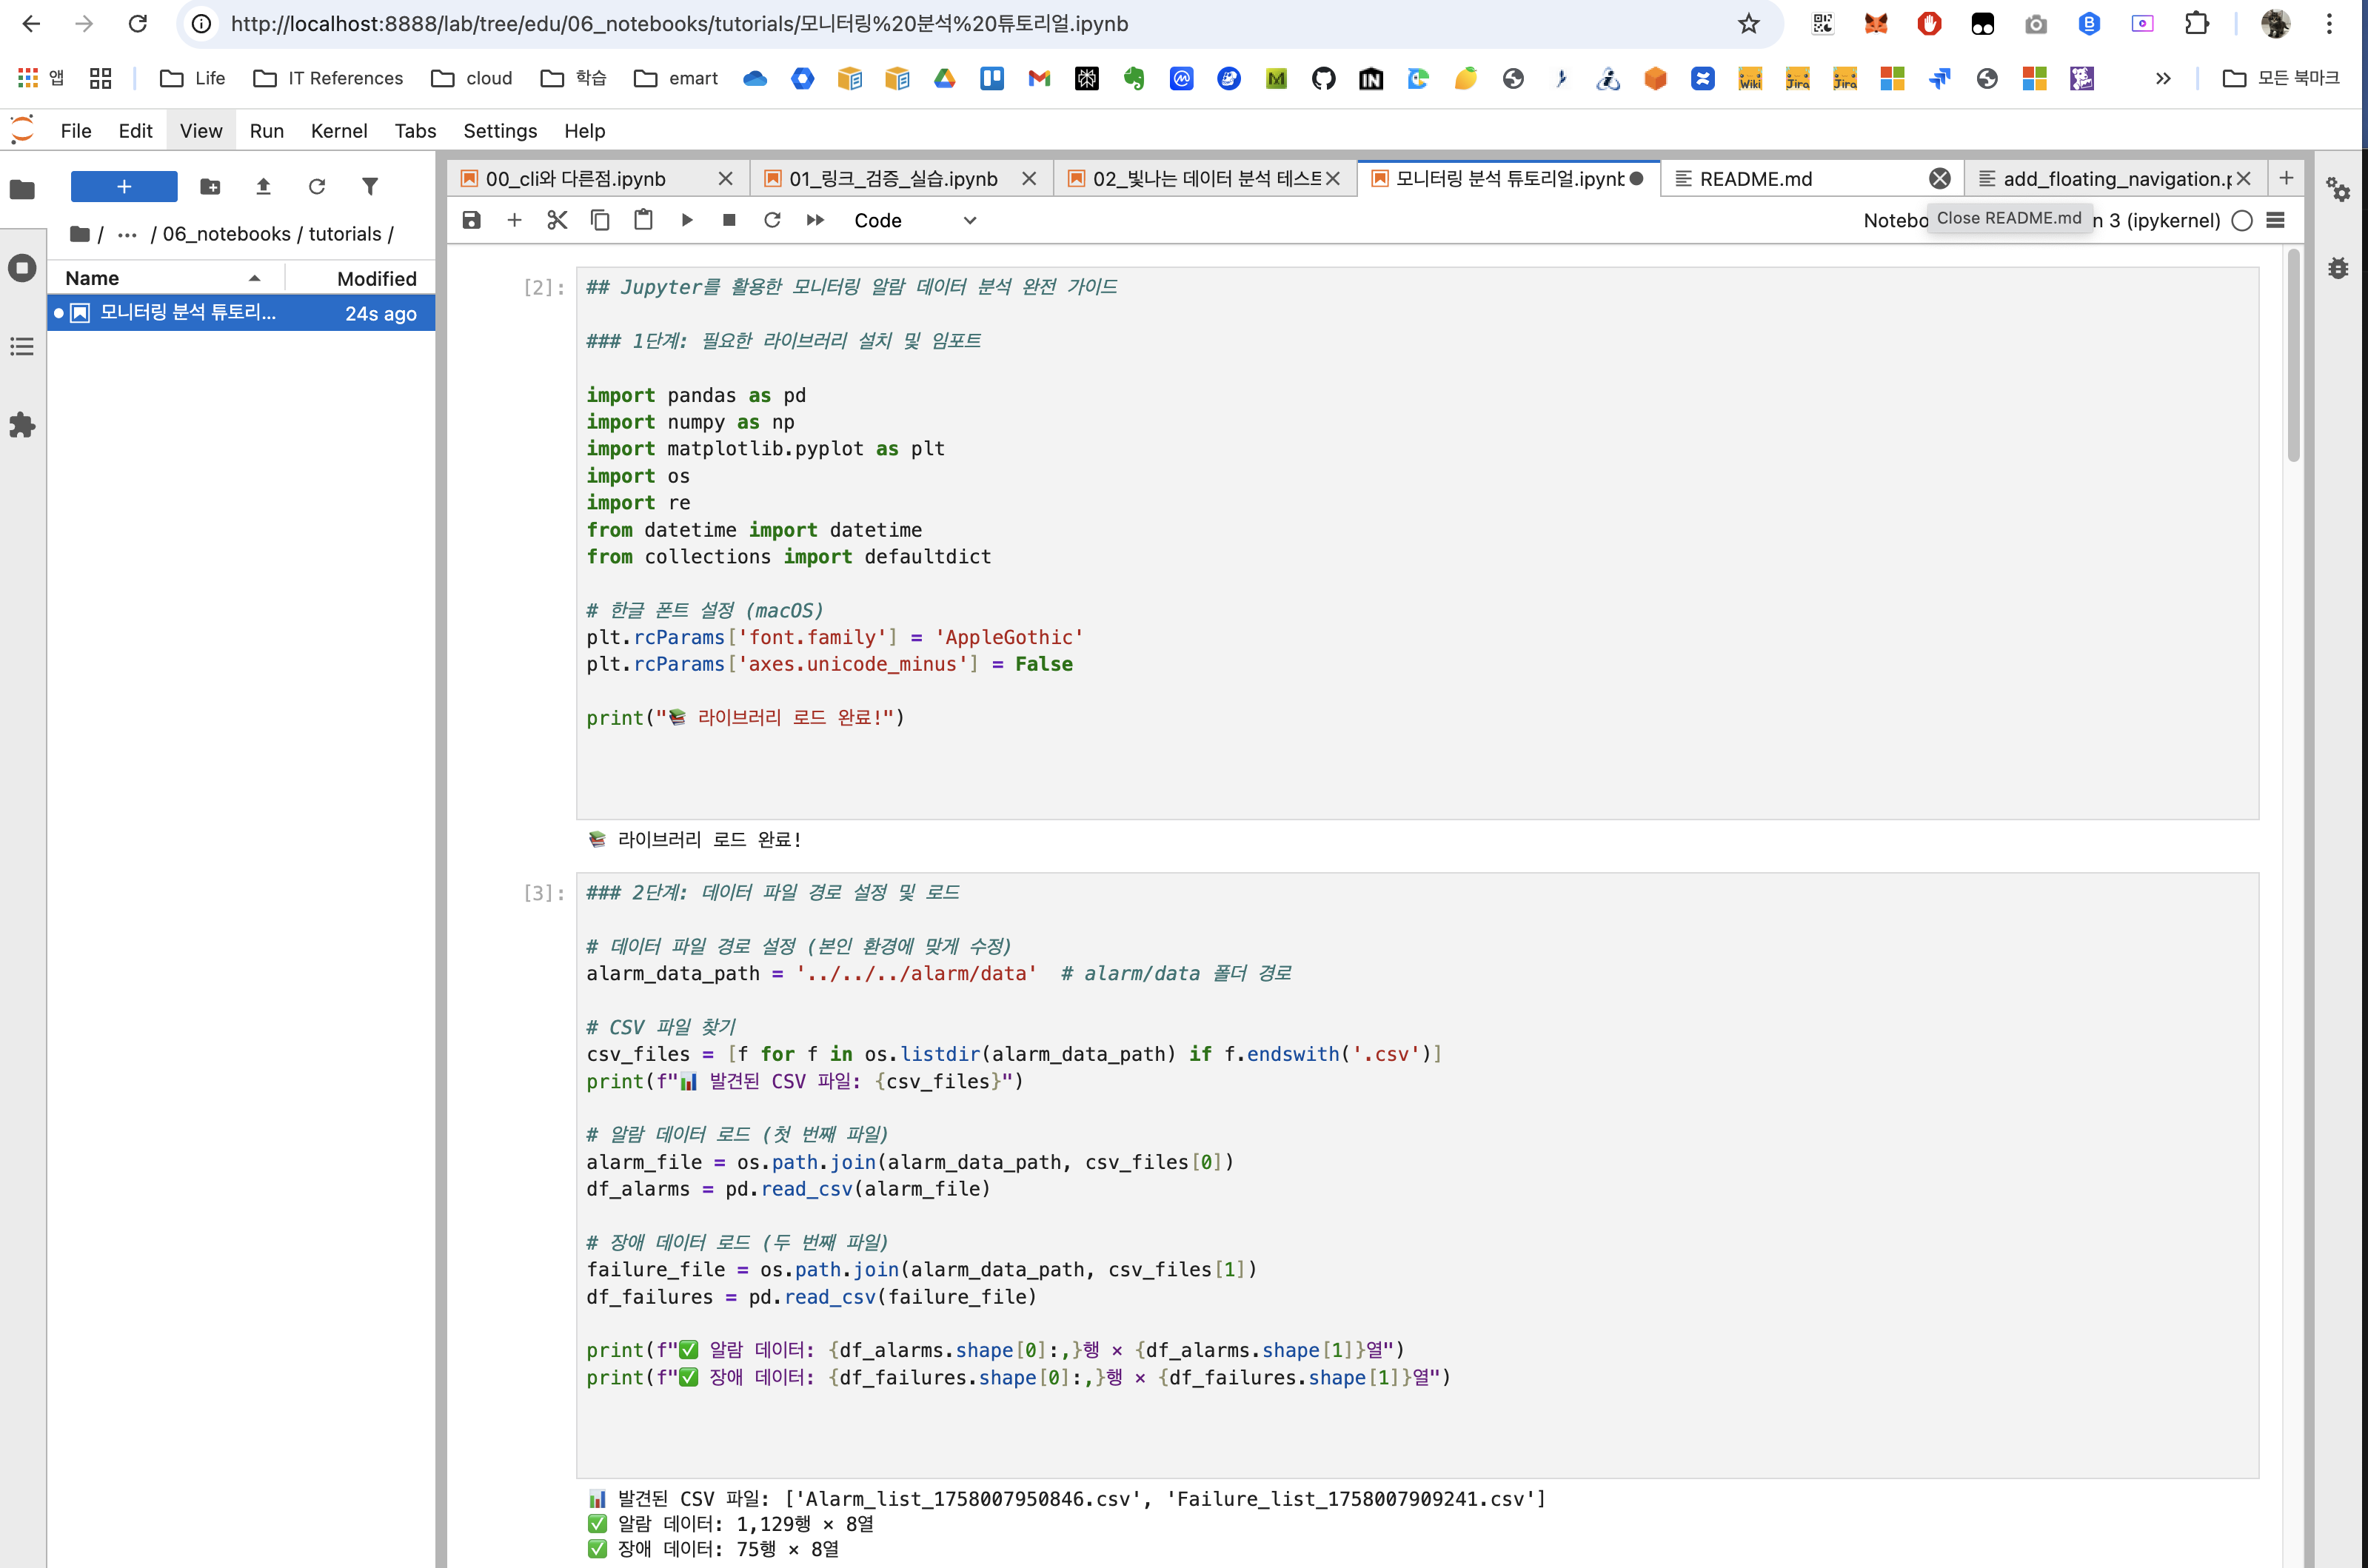
실제 Jupyter Lab 환경에서 모니터링 데이터 분석 중인 화면
🔹 1-3단계: 기본 설정
핵심: 분석 환경을 준비하고 데이터를 로드합니다
1단계: 라이브러리 임포트
import pandas as pd
import numpy as np
import matplotlib.pyplot as plt
import os
import re
from datetime import datetime

# 한글 폰트 설정 (macOS)
plt.rcParams['font.family'] = 'AppleGothic'
plt.rcParams['axes.unicode_minus'] = False

print("📚 라이브러리 로드 완료!")
2단계: 데이터 로드
⚠️ 주의: data_path를 본인 환경에 맞게 수정하세요
# 데이터 경로 설정
data_path = './data'  # 본인 환경에 맞게 수정

# CSV 파일 찾기
csv_files = [f for f in os.listdir(data_path) if f.endswith('.csv')]
print(f"📊 발견된 파일: {csv_files}")

# 알람 데이터 로드
alarm_files = [f for f in csv_files if f.startswith('Alarm_list')]
df_alarms = pd.read_csv(os.path.join(data_path, alarm_files[0]))

# 장애 데이터 로드
failure_files = [f for f in csv_files if f.startswith('Failure_list')]
df_failures = pd.read_csv(os.path.join(data_path, failure_files[0]))

print(f"✅ 알람: {df_alarms.shape[0]:,}행")
print(f"✅ 장애: {df_failures.shape[0]}행")
3단계: 데이터 구조 탐색
# 알람 데이터 구조
print("📄 알람 데이터:")
print(f"컬럼: {list(df_alarms.columns)}")
print(df_alarms.head(3))

print("\n📄 장애 데이터:")
print(f"컬럼: {list(df_failures.columns)}")
print(df_failures.head(3))
💡 Jupyter의 장점: 각 단계별로 결과를 확인하면서 다음 분석을 계획할 수 있습니다
🔹 4-6단계: 데이터 분석
핵심: 시간 기반 분석을 위한 전처리와 ERP 시스템 집중 분석
4단계: 날짜 전처리
# 날짜 변환
df_alarms['일자'] = pd.to_datetime(df_alarms['일자'])
df_alarms['월'] = df_alarms['일자'].dt.month

df_failures['발생 일자'] = pd.to_datetime(df_failures['발생 일자'])
df_failures['월'] = df_failures['발생 일자'].dt.month

print("✅ 날짜 전처리 완료!")
print(f"기간: {df_alarms['일자'].min()} ~ {df_alarms['일자'].max()}")
5단계: ERP 시스템 분석
# 계정그룹별 현황 확인
print("🏢 계정그룹별 현황:")
print(df_alarms['AccountGroup'].value_counts())

# ERP 데이터 추출
erp_alarms = df_alarms[df_alarms['AccountGroup'] == 'ERP'].copy()
erp_failures = df_failures[df_failures['AccountGroup'] == 'ERP'].copy()

print(f"\n🎯 ERP 알람: {len(erp_alarms):,}건")
print(f"🚨 ERP 장애: {len(erp_failures)}건")
print(f"📈 전환율: {(len(erp_failures)/len(erp_alarms)*100):.2f}%")
6단계: 월별 패턴 분석
# 월별 집계
monthly_alarms = erp_alarms.groupby('월').agg({
    '개수': 'sum',
    '유효알람': lambda x: (x == 'O').sum()
})

monthly_failures = erp_failures.groupby('월').size().to_frame('장애수')

# 결합 분석
monthly_combined = monthly_alarms.join(monthly_failures, how='outer').fillna(0)
monthly_combined['장애율%'] = (monthly_combined['장애수'] / monthly_combined['유효알람'] * 100).round(2)

print("📅 월별 현황:")
print(monthly_combined)
🔹 7-10단계: 심화 분석
핵심: 시간대별 패턴, 알람 유형, AWS 리소스 매핑 및 시각화
7단계: 시간대별 분석
# 시간대별 집계
hourly = erp_alarms.groupby('시간').agg({
    '개수': 'sum',
    '유효알람': lambda x: (x == 'O').sum()
})

# 시간대 구분 함수
def get_period(hour):
    if 6 <= hour < 12: return '오전'
    elif 12 <= hour < 18: return '오후'
    elif 18 <= hour < 24: return '저녁'
    else: return '새벽'

hourly['시간대'] = hourly.index.map(get_period)
time_summary = hourly.groupby('시간대')['유효알람'].sum()

print("⏰ 시간대별 알람:")
print(time_summary.sort_values(ascending=False))

print("\n🔥 가장 바쁜 시간 TOP 5:")
top_hours = hourly.sort_values('유효알람', ascending=False).head()
for hour, data in top_hours.iterrows():
    print(f"  {hour:2d}시: {int(data['유효알람'])}건")
8단계: 알람 유형 분석
# 카테고리별 분석
category_analysis = erp_alarms.groupby('Category').agg({
    '개수': 'sum',
    '유효알람': lambda x: (x == 'O').sum()
}).sort_values('유효알람', ascending=False)

print("🔍 알람 유형별 현황:")
print(category_analysis)

# 주요 원인 분석
print("\n📋 주요 발생 원인 TOP 5:")
causes = erp_alarms['발생 원인'].value_counts().head()
for i, (cause, count) in enumerate(causes.items(), 1):
    print(f"{i}. ({count}건) {cause[:50]}...")
9단계: AWS 리소스 매핑
# AWS 서비스 패턴 정의
aws_patterns = {
    'ALB': r'\[ALB\]',
    'EC2': r'\[EC2\]|i-[0-9a-f]+',
    'FSx': r'\[FSx\]|FSx ONTAP',
    'RDS': r'\[RDS\]|database',
    'S3': r'\[S3\]|bucket'
}

# 서비스별 알람 추출
service_alarms = {}
for service, pattern in aws_patterns.items():
    matches = erp_alarms[erp_alarms['모니터링 메시지'].str.contains(pattern, case=False, na=False)]
    if len(matches) > 0:
        service_alarms[service] = {
            '알람수': len(matches),
            '유효알람': (matches['유효알람'] == 'O').sum()
        }

if service_alarms:
    service_df = pd.DataFrame(service_alarms).T
    print("🔍 AWS 서비스별 알람:")
    print(service_df.sort_values('유효알람', ascending=False))
else:
    print("AWS 서비스 관련 알람이 발견되지 않았습니다.")
10단계: 시각화
# 종합 시각화
plt.figure(figsize=(15, 10))

# 1. 월별 트렌드
plt.subplot(2, 3, 1)
monthly_combined[['유효알람', '장애수']].plot(kind='bar', ax=plt.gca())
plt.title('Monthly Trend')
plt.xticks(rotation=0)
plt.legend()

# 2. 시간대별 분포
plt.subplot(2, 3, 2)
time_summary.plot(kind='bar', color='orange', ax=plt.gca())
plt.title('Alarms by Time Period')
plt.xticks(rotation=45)

# 3. 카테고리별 분포
plt.subplot(2, 3, 3)
category_analysis['유효알람'].head(5).plot(kind='pie', autopct='%1.1f%%', ax=plt.gca())
plt.title('Top 5 Categories')
plt.ylabel('')

# 4. 시간별 분포
plt.subplot(2, 3, 4)
hourly['유효알람'].plot(kind='bar', color='lightblue', ax=plt.gca())
plt.title('Hourly Distribution')
plt.xlabel('Hour')

# 5. AWS 서비스별 (있는 경우)
if service_alarms:
    plt.subplot(2, 3, 5)
    service_df['유효알람'].plot(kind='bar', color='lightcoral', ax=plt.gca())
    plt.title('AWS Services')
    plt.xticks(rotation=45)

plt.tight_layout()
plt.show()

print("📊 시각화 완료!")
🎯 학습 완료
✅ Jupyter의 장점을 체험했습니다:
- 단계별 실행으로 중간 결과 확인
- 즉석에서 추가 분석 가능
- 시각화 결과를 바로 확인
- 분석 과정이 문서로 보존
📊 CLI vs Jupyter 차이점:
- CLI: 스크립트 전체 실행 → 결과 확인
- Jupyter: 단계별 실행 → 탐색적 분석
🚀 다음 단계 제안:
- 다른 AccountGroup (이마트앱, 공용계정) 분석
- 예측 모델링으로 장애 예측
- Streamlit으로 실시간 대시보드 구축